Education, employment and unemployment
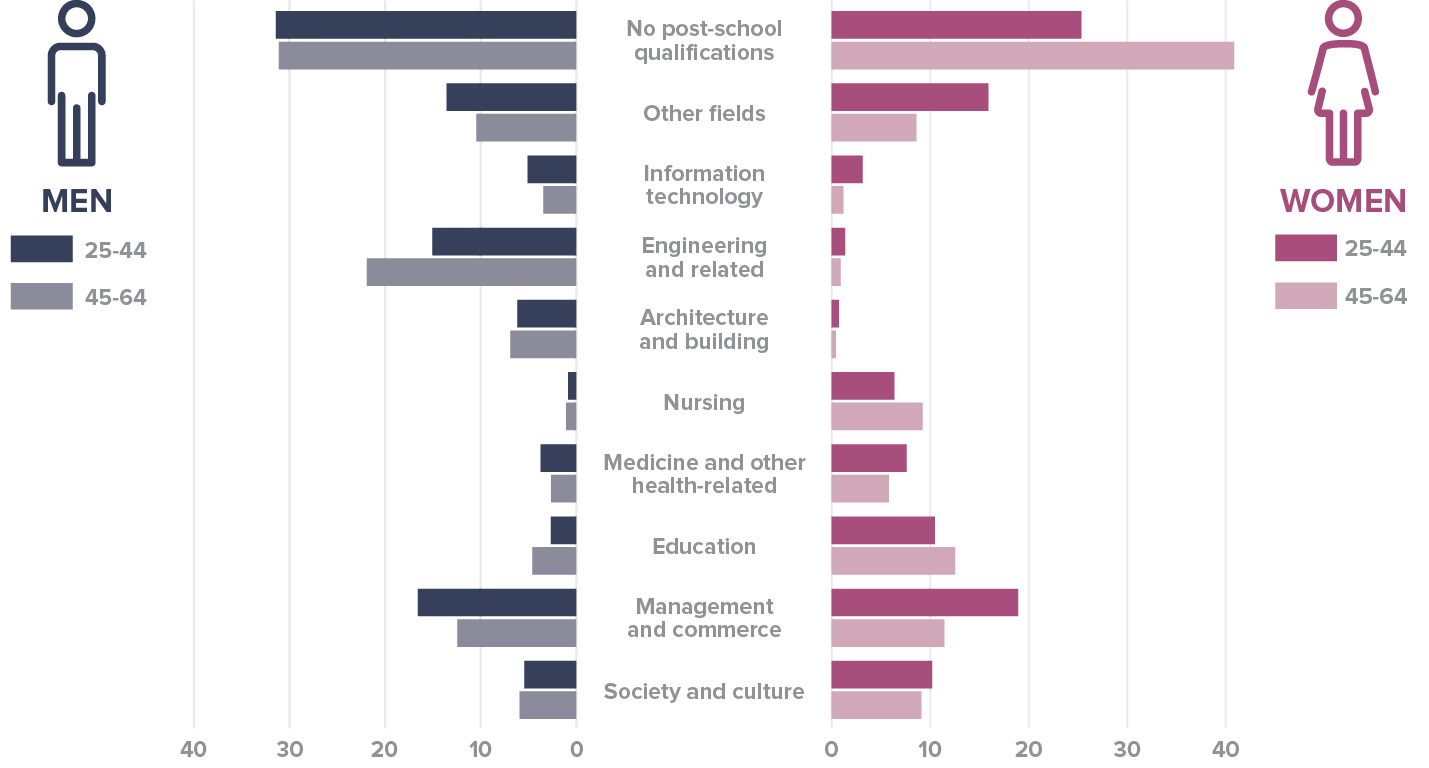
Field of study of men and women with post-school educational qualifications
In 2016, the HILDA Survey collected information on the main field of study of people with a post-school qualification. This information has been aggregated and analysed together with participant age and gender.In the figure below, we can see that the proportion of men aged 25 to 44 with post-school qualifications is quite similar to the proportion of men aged 45 to 64 with post-school qualifications. By contrast, more women aged 25 to 44 now have a post school qualification compared to women aged 45 to 64. In fact, more women than men in the 25 to 44 year age group have post-school qualifications (75% of women compared to 70% of men).
And what about field of study?
There are considerable differences in the fields of study between men and women. Health-related, education and society and culture fields are more common among women, while architecture and building, engineering and related and information technology fields are more common among men.
There are also considerable differences between the two age groups. For both men and women, management and commerce fields are much more prevalent among the younger cohort, while non-nursing health and information technology are also more common among the younger age group. ‘Other fields’, which include creative arts, food, hospitality and personal services, are also more common amongst the younger age group.
Time spent in paid and unpaid work by working age men and women
The HILDA Survey collects data on the number of hours and minutes spent in a typical week on paid and unpaid activities including travelling to and from work, household errands, housework, outdoor tasks and caring for family members. Analysis of this data allows us to explore how paid and unpaid work by men and women aged 15 to 64 has evolved between 2002 to 2016.
For men, in 2008, the average time spent on employment activities increased to 38.7 hours per week, decreasing to 35.9 hours per week by 2016. In 2016, men averaged 13.3 hours of housework, and since 2002, the time caring for family members has increased from an average of 4.8 hours per week to an average of 5.4 hours in 2016.
In 2002, women averaged more time on housework than on employment (22.8 hours versus 21.4 hours), but increases in time spent on employment and decreases in time spent on housework have seen this pattern reversed. Women’s time spent on care has increased, from 9.7 hours per week in 2002 to 11.3 hours in 2016.
Total time spent on paid and unpaid work
Unpaid work is largely invisible in conventional economic statistics, yet it is likely to be an important component of the 'real' economy that comprises both market and non-market production. Much of this non-market work can be classified as household production, involving child care, housework and preparation of meals, but non-market work also includes unpaid caring for elderly people and people with disability, and voluntary work (for example, for a charity).
The figure shows that men and women with dependent children have the longest weekly working hours, averaging over 70 hours per week on paid and unpaid work combined. Partnered women with children have the longest average working hours (76), followed by partnered men with children (73), lone parent men (72) and lone parent women (70).
The composition of working hours differs markedly between men and women, with a significantly higher proportion of men's working hours being paid. Interestingly, this is even true when comparing lone parent men and women.
Work long hours - it may be good for your marriage
Now you have a reason to work more! New research implies that being obsessed with your job is no longer the sin it used to be.
Many people believe that working long hours is damaging for personal relationships. However, recent studies have shown that the likelihood of divorce falls with the number of hours worked by the husband.
Research using the HILDA data from 2001 to 2006 has found that men in jobs with long hours are no more likely to divorce than anyone else. This research has also found that the optimal work arrangement is where the male works a 41-49 hour week. Beyond this the risk of separation rises, but is still lower than for couples where the male works a 35-40 hour week. The likelihood of separation declines with the duration of the marriage and with higher household income.
National paid parental leave
The funding of a national paid parental leave scheme has been placed on the Australian Government agenda after the release of a report using data unique to the Living in Australia study.
The Living in Australia study is one of the few sources of information in Australia that allows us to see what choices mothers make about paid work in the three years around the birth of a child. One in six mothers return to work before their babies are three months old, and a further 8 percent return to work withing 2 to 3 months of the birth of their youngest child.
The Productivity Commission Report found that mothers who go back to work as they are not entitled to paid maternity leave are struggling financially.
As a result, the Australian Government will introduce a comprehensive paid parental leave scheme for new parents who are the primary carers of a child born or adopted on or after 1 January 2011. Under this scheme, leave will be paid for 18 weeks at the federal minimum wage of about $544 a week.
Pathways into work
The pathways into work are many and varied. The experiences of 18 to 22 year olds interviewed in the Living in Australia study show this diversity.
Just over 40 per cent of people aged 18 in 2001 and 2002 were working, 45 per cent were undertaking some form of education at school, university or TAFE, and most of the remaining 14 per cent were unemployed.
By the time these people reached 22, 67 per cent were working, 15 per cent were undertaking some form of education and most of the remaining 18 per cent were either looking after children or were unemployed.
After leaving school, six out of 10 people undertook further study by the time they were aged 22. Some chose to study before working (46 per cent), some chose to work before studying (27 per cent) and some undertook further studies but had not started working yet (27 per cent). University level study was the most popular choice, though 16 per cent studied at TAFE instead and six per cent of people undertook TAFE studies prior to university studies.
Working from home
With the advances in information technology, it has been suggested that many of us in the future will no longer have to leave home to go to work. Data from the Living in Australia study suggest that this trend may already have begun, with 28 per cent of employed respondents indicating that at least some of their paid hours were worked from home.
For the large majority, however, working from home represents only a small fraction of the working week, with around half working 5 hours or less per week from home. People who were self employed were among those who worked most from home.
Nevertheless, Living in Australia study data indicate that hours worked at home represent 10 per cent of all hours worked, which is far from insignificant.
Jobless households
A major source of financial hardship is joblessness. Common with many other developed nations, in recent decades Australia has seen the available pool of employment become increasingly polarised into households where either no adult is working or where all adults are working.
Restricting attention to the working age population and excluding full-time students, the Living in Australia study shows that 16.0 per cent of all working-age households, had no adult in paid employment. This compares with 62.0 per cent of households where all adults were employed.
Of particular concern is the number of children living in jobless households. The Living in Australia study reveals that 1 in every 7 children are growing up in a household with no employed adult. This is relatively high by international standards.
Of course, the implications of joblessness are far less serious if it is only a short term phenomenon. By tracing changes in income and joblessness over time for the same set of individuals, we are able to examine transitions into and out of poverty and attempt to identify factors that cause these changes. Longitudinal studies have shown that a high proportion of the poor are suffering from temporary poverty, resulting from a major life event such as divorce, illness or redundancy. Data from the first three years of the Living in Australia study shows that, although during this period 21.4 per cent of people were recorded to be in poverty for at least one year, only 3.4 per cent of the population were in poverty for all three years.
Non-standard jobs
The following table reports mean scores on questions addressing satisfaction with various aspects of the job, cross-classified by the type of employment contract. The scores range from 0 to 10.
Mean Job Satisfaction (on 0 - 10 scale) by Employment Type
Further analysis of the results from the study, however, reveals that the lower levels of job satisfaction reported among casual employees depends critically on the number of hours worked. The majority of casual employees work part-time hours, and these casuals are no less satisfied than permanent employees (both those working part-time and those working full-time). In contrast, casuals working full-time hours are much less satisfied with their jobs than otherwise comparable permanent employees.
Work-family balance
A major emerging social issue is that of striking the right balance between work and family life. The Living in Australia study involves the collection of a wide range of data that will help cast light on this issue. In the following table, for example, we report the responses of working parents to a series of statements concerning the difficulties of combining work and family responsibilities.
Satisfaction with Work - Family Balance
(% of working parents agreeing/disagreeing with the following statements)
The results presented in this table indicate that between 31 and 59 per cent of men in full-time jobs, and between 32 and 53 per cent of women in full-time jobs, report adverse consequences for family life as a result of their work commitments.
As might be expected, those in part-time jobs (and especially the women) were less likely to report work-family conflicts. Furthermore, though not reported here, the likelihood of conflict is especially acute among persons regularly working long hours each week.
Who works more - men or women?
A common assumption is that since men are more likely to hold full-time jobs in the paid workforce, men will also work longer hours than women. If we take a broader view of work and also include housework, caring, charity work and commuting time, then it is women who work longer, but only just.
Information from the Living in Australia study reveals that among couples:
- Men work 63 hours per week on average,
- Women work 64 hours per week on average,
- Men spend the largest fraction of their time in paid work (or traveling to and from work), and
- Women spend a much larger fraction of their time than men on housework (31 per cent) and on child care (18 per cent).
Working for an education
Almost 12 per cent of people are studying for a post-school qualification. Most of these people are also in paid employment.
Of the students studying for a post school qualification:
- 44 per cent also have a full-time job, and
- 30 per cent have a part-time job.
The Living in Australia data indicates that:
- Full-time workers tend to study part-time and part-time workers tend to study full-time,
- The average full-time student who also has a job works about 22 hours per week, is in their mid twenties and typically has a casual job or a contract for a fixed-term, and
- The average part-time student who also has a job, is much older, is in their mid thirties, works a 40 hour week and is typically employed on an ongoing or permanent basis.
Percent of students enrolled in post-school education that work
Changing jobs
Based on data collected from persons who responded in the first two years of the Living in Australia study, just over two-thirds of the Australian adult population were employed for at least part of the time between late 2001 and late 2002. As shown in the figure below, the majority of this group (82%) was employed at both the start and end of this period. Moreover, the majority (69%) was continuously employed with the same employer. Of the remainder, about one-quarter ceased at least one job during this period and the remaining 6 per cent were job starters who were still employed at the end of the period.
Of those persons who had held a job at some time during the period between the Living in Australia 2001 and 2002 interviews (effectively a one year period), about one-quarter had ceased a job during that time. Of these, 59 per cent can be described as job leavers; that is, they quit or retired from their job through their own choice. There is a further 36 per cent who lost their job because of dismissal, retrenchment or business closure, or because the job had only been temporary. There is a further 5 to 6 per cent who also might be described as job losers, but for reasons that are mostly outside the influence of employers – poor health.
These figures translate to the following job mobility rates:
- Job leaver rate: 14.9%
- Job loser rate: 9.0%
As might be expected, the voluntary job changers (i.e., job leavers) tend to express greater levels of job satisfaction with their new job than their previous job. This can be seen in the figure below, which uses data from the sample of respondents in both waves, to report changes in job satisfaction by whether someone changed a job and why. People who made their own decision about leaving their job were much more likely to report an increase in job satisfaction than people who remained in the same job. In other words, when people quit they tend to find jobs they like better.
More surprising, even among those who were retrenched or fired, the proportion reporting that their new job was better than their previous job was larger than the proportion reporting the reverse. This is especially significant given that the average respondent who was still in the same job as a year earlier was slightly more likely to report a decline in job satisfaction.
Overall, these results suggest that despite widespread fear of change, people who change jobs are much more likely to report improvements in job satisfaction than people who remain in the same job.
Job discrimination in Australia
In 2008 and 2010, we asked respondents whether they believed they had experienced discrimination by an employer in the past two years on the basis of their gender, age, ethnicity, religion or parenting responsibilities. Respondents who had applied for a job in the last two years were asked whether they had been discriminated against in applying for a job, and all respondents who had been employed in the last two years were asked if they had been discriminated against in the course of employment.
The data collected shows that approximately 8.5% of job applicants and 7.5% of employees believe they have been discriminated against in the preceding two years on the basis of their gender, age, ethnicity, religion or parenting responsibilities.
The most commonly cited reason for discrimination is age, although gender is also frequently cited in respect of discrimination in the course of employment.
Percentage of job applicants and employees in Australia experiencing job discrimination
Are casual employees always less satisfied with their jobs?
Many Australians today are employed on either a casual or temporary basis in jobs that it is often argued are low quality. If so, we might expect casual and fixed-term contract employees to report relatively low levels of satisfaction with their jobs.
But what does HILDA tell us?
- Australian employees report job satisfaction levels that average 7.6 on a 0 to 10 scale.
- The average differences across categories of employees are very small, if not negligible.
- Differences do emerge, but only once we distinguish employees working irregular schedules from those working regular schedules.
- The only employees that report significantly lower levels of job satisfaction are casual employees working irregular schedules (about 7% of all Australian employees) and fixed-term contract workers working irregular schedules (just 1.5%).
Home workers do longer hours for less
Analysis of the HILDA data has "linked working from home with lower pay, a tendency to work longer hours and an intrusion of work into home life". Researchers have found that although some employees who work from home experience higher job satisfaction, others result in longer working days and a disturbed home life.
The analysis showed that the number of people working from home make up 16 per cent of employees - a decline of 2 per cent over the past decade, with only 6 per cent of those working at home for more than 8 hours per week.